Longread
Evaluating size and weight of fresh produce
Quality traits are either used to determine the moment of harvest or to classify the harvested produce. One way to look at quality traits is to relate them to the international standards made by the UNECE for commercial classification. For each produce, a classification chart describes the standards for Class Extra, Class I and Class II. To classify a marketable produce according to its quality, different traits are taken into account. However, extra local specifications may apply as the concepts and standards of quality may vary per company, country and per produce.
The measurements of weight, size and shape are discussed in this text where examples are given. You can read in other longreads about other traits, such as colour, texture, and volatile organic compounds released by the produce.
Measuring size by weight
When classifying a produce a certain range must be respected to ensure the consistency of the batch. Indeed, a minimum and maximum weight may apply as well as a maximum range within the batch. Measuring produce weight is often integrated into the sorting and grading process. The weight of the packaging is therefore excluded and the produce is weighed individually with an electronic weight grader on the conveyor belt.
If this type of technology is not available, the fruits are often graded visually by size in diameter by a quality controller worker. Samples are taken after sorting and grading for quality control.
For example, the range of the fruit size by weight of apples packed in rows or layers may be as low are 15 g for apples weighing between 70 and 90 g. Note that the weight difference of the fruit increases with the range (See Tables 1 for Class Extra and Table 2 for Class 1, Source FFV-50: Apples, UNECE, 2020).
Table 1. Weight classes of apples, grouped by range and allowed weight difference per apple fruit of the same packaging for Class Extra.
| Range (g) | Weight difference (g) |
|---|---|
| 70-90 | 15 |
| 91-135 | 20 |
| 136-200 | 30 |
| 201-300 | 40 |
| >300 | 50 |
Table 2 Weight classes of apples, grouped by range and allowed weight difference per apple fruit of the same packaging for Class I
| Range (g) | Weight difference (g) |
|---|---|
| 70-135 | 35 |
| 136-300 | 70 |
| >300 | 100 |
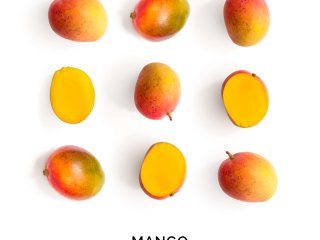
For mango, a similar classification is in place. However, mango fruits are divided into size codes: A, B, C and D where size D is the biggest size for mango heavier than 800 g each (Table 3). The minimum weight per fruit is 100 g.
Table 3. Weight classes of mango, grouped by range and allowed weight difference per mango
| Size code | Range (g) | Weight difference (g) |
|---|---|---|
| A | 100-350 | 75 |
| B | 351-550 | 100 |
| C | 551-800 | 125 |
| D | >800 | 150 |
Measuring size by diameter
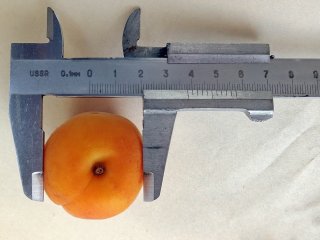
The diameter of produce can be measured using sizing rings or callipers (figure 3). Measuring produce using sizing rings is done by passing fruit over different sizing rings, ordered from small to large. The size of the fruit is determined by the ring the fruit can pass through. The diameter of the produce can be used in pre-harvest as one of the traits to determine if the produce is ready to be harvested. It can also be used as a quality control indicator after sorting and grading.
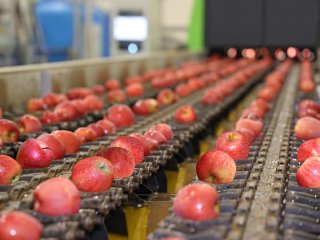
The diameter (and weight) can also be measured in the garding and sorting line at the singulation step using electronic systems and software (figure 4). Several technics can be used. One technic used it to let the produce rotate on the conveyor belt line. The produce is exposed from all angles to high-speed cameras. With the combination of several images with the use of algorithms, the diameter is determined. Some systems can also measure at the same time the weight, length, and curvature (shape).
Diameter sizing is sometimes also use for classification. For example, a minimum diameter of 60 mm is required by the UNECE for apples, unless the Brix level is equal to or greater than 10.5 °Bx. In this case, the minimum diameter is 50mm (or 70g). To ensure uniformity, a range of only 5 mm within the same batch of apples is allowed for Class Extra, whereas a range of 10mm for Class I applies.
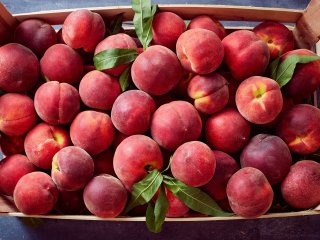
Peaches and nectarines are also classified according to their diameter where the minimum diameter is 51mm. The classification of peaches and nectarines using the diameter as reference according to the UNECE is shown in table 4. Note that weight can also be used as a reference for classification.
Table 4. Classification of peaches and nectarines according to the diameter (mm) or weight (g).
| Code | Diameter (mm) | Weight (g) | |
|---|---|---|---|
| 1 | D | 51-56 | 65-85 |
| 2 | C | 56-61 | 85-105 |
| 3 | B | 61-67 | 105-135 |
| 4 | A | 67-79 | 135-180 |
| 5 | AA | 73-80 | 180-220 |
| 6 | AAA | 80-90 | 220-300 |
| 7 | AAAA | >90 | >300 |
Measuring shape
This article provides 3 examples of measuring the shape of a produce as a quality trait: the angularity of a banana, the fullness of mango cheeks and the compactness of broccoli.

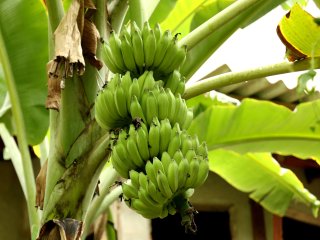
As bananas grow, the diameter of banana fingers changes from an oval to a rounder shape. The angularity of banana fingers can also be described as ‘light three-quarters’ to ‘round full’ (A.K. Thompson et al, 2019). However, this is a subjective measurement. For more objective measurement, the diameter of the banana of a specific finger is measured. This finger is the middle finger one of the outer whorl of the second hand of the bunch is measured. The entire set of bananas is called a bunch (figure 7). The hands are the rows of bananas and are counted from the top of the bunch. The second hand is the second row from the top.
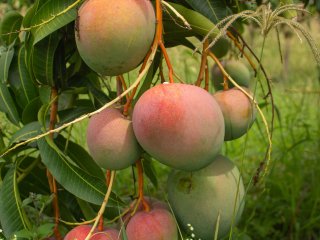
Second, the cheek of a mango refers to both sides of the seeds. When the mango is immature, the cheeks are still flat. When a mango is fully mature, the cheeks are full. The fullness of the cheeks is cultivar dependent. Cultivars such as Tommy Atkins, Rapoza or Kent show this attribute quite clearly. Others, such as Nam Doc Mai or Zillate show flatter cheeks at maturity. While this trait is important to evaluate mango maturity in these cultivars, the fullness of the cheek is not part of the UNECE classification.
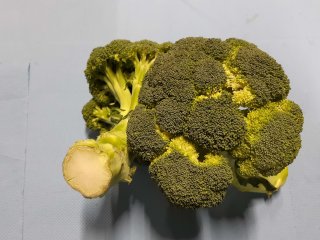
The third example in this article is the compactness of a produce. This is applicable to produce such as broccoli. For broccoli to be classified as Class I, the florets must be firm and compact. If the florets are slightly loose or less compact, the broccoli is classified as Class II. The broccoli is considered less compact when yellow/white lines are showing between the floret (figure 9). The yellow/white lines are not due to senescence or pigmentation changes. As the broccoli becomes less compact, the parts once hidden low in chlorophyll are now visible. Not to be mistaken with the yellowing of the broccoli, which can also occur as a result of chlorophyll breakdown, e.g. due to ageing or exposition to ethylene.
How to measure size and shape
As previously mentioned, commercial measurement of the size and shape is often integrated into sorting and grading lines. Thanks to computer vision, integrated scales and algorithms, the weight, diameter and shape of produce are measured online. Subsequently, the produce is grated and sorted. Once again, note that the classification discussed in this text is the one of the UNECE (according to the lasted version when this text was written) and other different local requirements may apply in your region.
Measuring the size and shape improves the consistency of the delivered produce, which is key to developing efficient food chains.
Trends in practice
Consistency of quality is very important to reduce food losses and waste. As the stakeholder in the chain knows which level of quality to expect, the chain can move smoothly and rapidly. A system of sorting and grading is combined with a Standard Operation Procedure (SOP) for postharvest best practices. This also helps reducing food losses and waste. But what do we do with the rejected produce based only on esthetic criteria?
Although this article was all about consistency of quality, not all produce have to be perfect. There are increasing initiatives on the market to sell malformed fruits and vegetables for a lower price. Another example are companies transforming malformed produces into other products such as soup. These initiatives allow saving food from being wasted.
Used references for this longread
A.K. Thomspon et al. (2019) Banana Ripening: Science and Technology. Springer Briefs in Food, Health, and Nutrition. Switzerland. ISBN 978-3-030-27739-0 (eBook) https://doi.org/10.1007/978-3-030-27739-0.
United Nations (2017). UNEVE standard FFV-26: concerning the marketing and commercial quality control of peaches and nectarines. New York and Geneva. Microsoft Word - 26Peaches_2017_e (unece.org)
United Nations (2017). UNEVE standard FFV-45: concerning the marketing and commercial quality control of mangoes. New York and Geneva. Microsoft Word - 45Mangoes_2017_e (unece.org)
United Nations (2019). UNEVE standard FFV-48: concerning the marketing and commercial quality control of broccoli. New York and Geneva. Microsoft Word - 48Broccoli_2019_e.doc (unece.org)
United Nations (2020). UNEVE standard FFV-50: concerning the marketing and commercial quality control of apples. New York and Geneva. Microsoft Word - 50Apples_2020_e.docx (unece.org)